Making sense of classroom data: How ClassMap’s analytics empower teachers
Teaching isn’t just about delivering lessons, it’s about understanding students, identifying engagement patterns, and making data-driven decisions to improve learning outcomes. ClassMap’s Class Analytics provides educators with real-time insights into student participation, engagement, and well-being. Let’s explore how teachers can leverage this powerful tool to enhance classroom management.
Why use classroom analytics?
With the right data, educators can go beyond assumptions and truly understand what’s happening in their classrooms. ClassMap helps teachers:
- Identify engagement trends
- Monitor student participation
- Support student well-being
- Improve classroom behavior
- Personalize learning strategies
Key metrics and what they mean
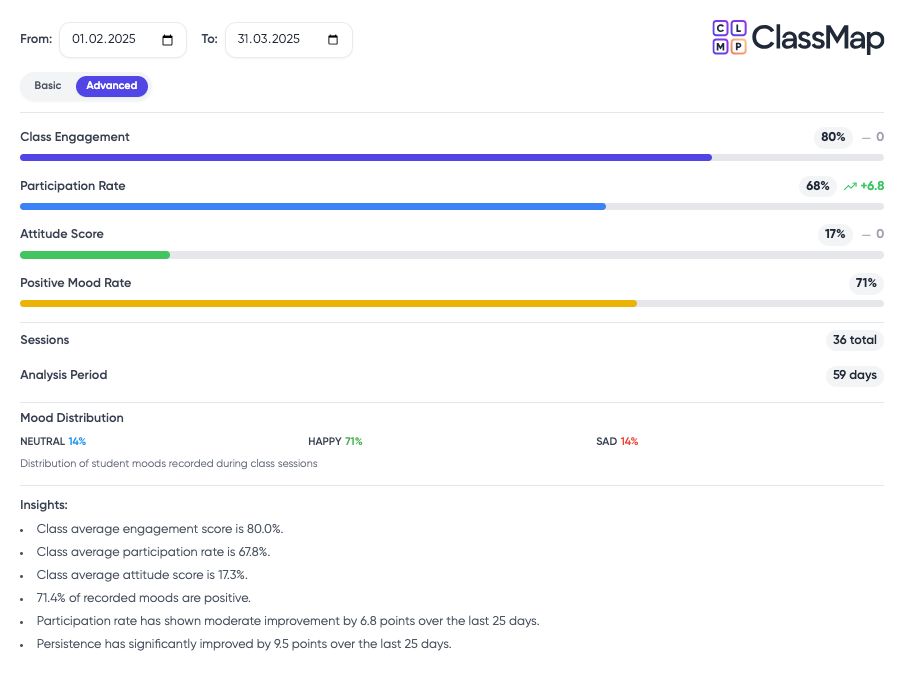
1. Class engagement score
Tracking engagement levels helps teachers see how actively students are involved in lessons. A high engagement score suggests students are motivated, while a decline may signal distractions or disengagement.
- Example insight: If engagement drops on certain days, teachers can adjust lesson formats or introduce more interactive activities.
2. Participation rate
ClassMap measures how frequently students contribute to discussions, group work, and activities.
- Improvement tip: If participation is low, try incorporating more collaborative learning exercises.
3. Attitude score
This metric reflects overall student behavior and mindset. A low attitude score may indicate frustration or lack of interest.
- Classroom strategy: Recognizing attitude shifts allows teachers to implement motivational techniques and positive reinforcement.
4. Positive mood rate & mood distribution
Emotional well-being directly impacts learning. ClassMap tracks student moods to help teachers foster a supportive environment.
- Actionable step: If a large portion of the class records neutral or sad moods, consider adjusting workload, or checking in with students.
How ClassMap transforms teaching
1. Spot trends & make adjustments
Teachers can track how participation and engagement evolve over time. For example, if participation improves by 6.8% over a month, it signals a successful classroom strategy.
2. Improve student well-being
With mood distribution insights, teachers can intervene early when students show signs of stress, disengagement, or frustration.
3. Personalize learning approaches
By analyzing individual and class-wide trends, teachers can tailor lessons to match student interests and optimize learning experiences.
Best practices for using class analytics
- Check data regularly – Identify trends over time to adjust teaching methods.
- Encourage student feedback – Discuss insights with students and adjust based on their needs.
- Use data for parent-teacher meetings – Share insights to create personalized learning plans.
- Adapt strategies as needed – Experiment with different teaching techniques and track their impact.
Why choose ClassMap?
✔ Real-time insights
- Get instant feedback on student engagement and mood
- Monitor participation trends effortlessly
✔ Easy-to-use interface
- Simple dashboard for quick data interpretation
- Visual analytics for better decision-making
✔ Actionable data
- Helps teachers tailor lessons to individual and class-wide needs
- Enables early intervention for struggling students
Conclusion
ClassMap’s analytics turn classroom data into actionable insights, helping teachers create engaging, student-centered learning environments. By tracking participation, engagement, and well-being, educators can ensure every student gets the support they need to thrive.
Want to see how ClassMap can transform your teaching? Sign up for a demo today!